Project Resources
Powered by GIScience
…to get your next project started.
Affordable solutions
3 day turnaround on shapefiles
Bundle a GIS service with your SWPPP

Shape Files
Shape files are increasingly being requested by local municipalities during plan review to determine where your project is located. Shape files are a geographic vector data format that can store data related to the location, shape, and an unlimited number of attribute data related to a geographic feature, such as a piece of property.

Site Maps
Need a site map for your project? A number of municipalities are requesting site maps for projects under an acre, to illustrate the location of erosion and sediment controls and other on-site BMPs on-site.

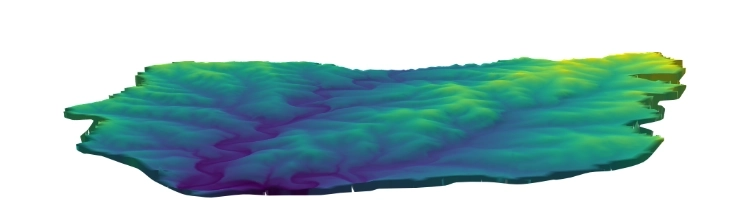
Contour Mapping
Need contour maps for a project? You can now order contour maps with a resolution down to one meter. When it comes to stormwater planning, design, and management, there is no greater factor than slope.
Frequently Asked Questions
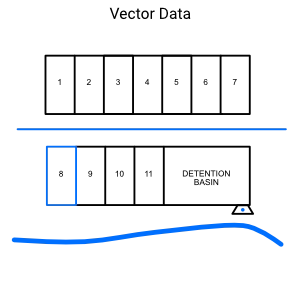
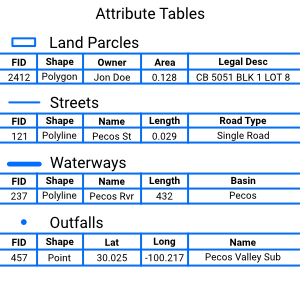
A shapefile is a data format that illustrates geographic features spatially using points, lines, and polygons while storing attribute data related to each feature. The figure shown below illustrates multiple lots as polygons in a subdivision, with a street and creek as polylines, and finally an outfall from the detention basin as a point. Each of these features and their corresponding attribute table can provide valuable data to plan reviewers. During plan review shapefiles can be utilized to determine the location of your project in relation to key geographic boundaries, such as jurisdictions, floodplains, and right-of-ways.
- – Locations of earth-disturbing activities, including demolition activities.
- – All temporary and permanent structural controls.
- – Approximate slopes for grading activities, indicated by existing and proposed contour lines.
- – Areas designated for staging or stockpiling construction materials.
- – Any receiving water ways intersecting the site;
- – Designated points where vehicles will exit onto paved roads.
- – Proposed structures and other impervious surfaces.
- – On-site and off-site construction support activity areas.
- – Receiving waters within the site and all receiving waters within one mile downstream of the site’s discharge point(s).
Site maps for SWPPP exempt projects
Municipalities are increasingly requiring the submission of a site map for projects exempt from developing a Stormwater Pollution Prevention Plan (SWPPP). These maps are needed to develop a site plan illustrating the placement of temporary structural controls such as silt fences, trash dumpsters, and concrete washout areas. The aim is to show their location in relation to on-site sources of pollution generated from concrete trucks, construction waste, and stockpiling.
The vast majority of construction projects involve altering the existing grade of the site to meet their needs. This alteration changes the way stormwater runoff moves across the site, leading to different flow dynamics and stormwater discharge points. Contour maps play a critical role in stormwater planning and management by providing the ability to calculate slope. Designers can then determine the amount of temporary erosion and sediment controls needed to prevent sediment from being displaced (erosion control) and to capture sediment carried by stormwater before it exits the site (sediment control).
A geographic information system (GIS) is a system used for capturing, managing, analyzing, and displaying data geographically. There are two data formats that a GIS system uses:
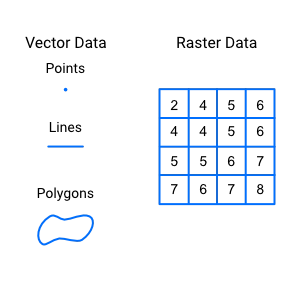
Vector data is represented by points, lines, and polygons, illustrating the geographic position of one feature to another. It is highly precise and suitable for representing discrete features like roads, rivers, and structures, with an ability to store an unlimited number of attribute data related to each feature.
Raster data is represented by a matrix of cells, with each cell containing a value. A typical example of a raster dataset is satellite imagery, where each cell represents a set of red, green, and blue (RGB) values. This format is commonly used for representing continuous phenomena such as elevation, temperature, and land cover..